
Testosterone level calculator
After an injection, testosterone rises for a day or two, peaks, then falls until the next dose. It takes about five half-lives (about 3 weeks for cypionate or enanthate) before every week looks the same. Enter your current prescription to see that curve, with its peak, its trough and how uncertain it is.
This is an educational estimate, not medical advice. It doesn’t recommend a dose. Real levels vary a lot between people; only a blood test shows yours. Talk to your prescriber before changing anything. This shows the shape of the curve, not your level.
≈ 3 weeks
Estimate · not a lab result- Estimate
- Uncertainty
- Peak · trough
- Injection
- Peak after an injection
- ≈ 2 days
- Drop from peak to trough
- 41%
- Weekly total
- –
Your dose sets how high the curve sits, not its shape. That is why the chart is relative and works without it.
Your real curve, with every injection you log and your lab results laid on top. That’s TRTracker.
TRTracker draws this curve from your real doses and labs. Free on iPhone.
How it works
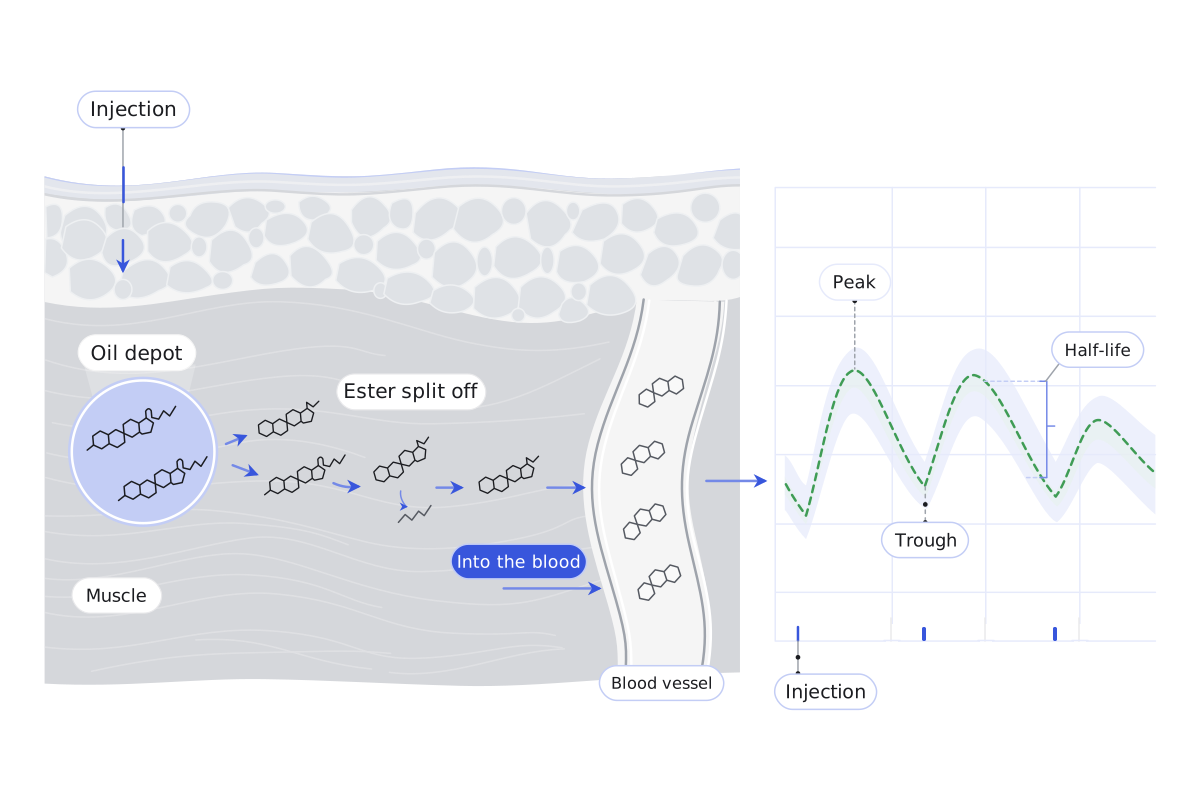
This is the same model the TRTracker app uses before it has any of your lab results. Each injection is treated as a depot: the hormone is absorbed from the oil over a day or so, then cleared at a steady rate. In pharmacology this is a one-compartment model with first-order absorption (a Bateman curve). Your levels at any moment are the sum of what is left from every injection so far.
| Ester | Effective half-life | Absorption half-life | Steady state |
|---|---|---|---|
| cypionate | 4.5 days | 24 hours | ≈ 23 days |
| enanthate | 4.5 days | 12 hours | ≈ 23 days |
| propionate | 0.8 days | 2.4 hours | ≈ 4 days |
| undecanoate (injectable) | 33.9 days | 36 hours | ≈ 170 days |
Why 4.5 days for cypionate and enanthate? The US cypionate label quotes about 8 days, the enanthate label 2–3 days, and a population study of cypionate found about 4 days. Studies that compared the two esters directly found them alike. The app and this calculator use 4.5 days for both. Half-lives also differ between people.
The shaded band shows that spread. It redraws the curve with a half-life roughly half as long and twice as long (the middle 95% of the range the app assumes) and adds a small allowance for dose-to-dose variation. It is a model uncertainty, not a healthy range or a target.
Steady state is taken as five half-lives after you start or change a protocol. With your last injection date, the chart assumes you have been on the protocol long enough to be settled and marks today.
What it leaves out: your own testosterone production, SHBG and binding, missed or late doses, and differences between oils and injection sites. That is why it shows a shape, not a number. Only a blood test shows your level.
Sources
- Depo-Testosterone (testosterone cypionate) prescribing information, DailyMed
- Testosterone enanthate summary of product characteristics, §5.2 pharmacokinetics (emc)
- Bi Y et al. Population pharmacokinetics of testosterone cypionate. CPT Pharmacometrics Syst Pharmacol, 2018
- Fujioka M et al. Pharmacokinetic properties of testosterone propionate in normal men. J Clin Endocrinol Metab, 1986
- Behre HM et al. Intramuscular injection of testosterone undecanoate. Clin Endocrinol, 1999
- Subcutaneous versus intramuscular testosterone injection. J Endocr Soc, 2017
Questions
What is the half-life of testosterone cypionate?
Labels and studies disagree. The US label quotes about 8 days, population studies estimate closer to 4 days, and head-to-head studies find cypionate and enanthate behave alike. This calculator, like the TRTracker app, uses an effective half-life of 4.5 days for both, and the shaded band shows what a shorter or longer half-life would do.
How long does it take testosterone to reach steady state?
About five half-lives after you start or change a protocol. With a 4.5-day effective half-life that is roughly 3 weeks for cypionate or enanthate. Propionate settles within days; injectable undecanoate takes months.
Why does the chart not show ng/dL?
The same dose gives very different blood levels in different people. Without your own lab results, any number would be a guess. The chart shows the shape of the curve, relative to its peak. The TRTracker app can scale the curve to your own timed lab results.
Does splitting my weekly dose make levels more stable?
In this model, injecting the same weekly amount more often gives a smaller drop between peak and trough. Whether to change how you inject is a decision for your prescriber.
Is subcutaneous different from intramuscular?
Studies of subcutaneous testosterone injections found levels in a similar range to intramuscular ones. The model treats them the same, so the route is shown as a note only.
Is anything I type saved?
No. The calculation runs in your browser. Nothing is stored or sent.
More free tools
- Low-T symptom self-checkEleven quick questions about symptoms that can go with low testosterone, and what to ask your clinician.
- Injection volume calculatorTurn your prescribed mg dose into mL and insulin-syringe units, with the syringe drawn to the line.
- Injection site rotation plannerPick your approved sites and schedule, and see where your next 8 injections go on a body map.
- Blood-test timing plannerWork out when to book a trough or midpoint draw from your last injection.
- Injection schedule plannerLay out 12 weeks of injection dates, with the trough blood-test window before each one.
- Free testosterone calculatorEstimate free and bioavailable testosterone from total T, SHBG and albumin (Vermeulen).
- Vial supply calculatorSee how many injections a vial holds and when you will need a refill.
- All toolsEvery free calculator, including the ones on the way.
Your real curve, in your pocket
Log each injection and lab result. TRTracker redraws the curve for you, with the uncertainty range.
Download on the App Store Scan with your iPhone
Free tools for education only. Nothing you type here is stored; the maths runs in your browser, and your result is only sent if you ask us to email it. TRTracker does not provide medical advice, diagnosis or treatment. Privacy policy